Accurate Measurement and Verification (M&V) with Clockworks FDD
January 18, 2024
Ditch the Spreadsheet: Accurate Measurement and Verification (M&V) with Clockworks Fault Detection and Diagnostics (FDD)
Fault detection and diagnostics (FDD) software is becoming increasingly accepted as an essential tool in the modern energy management process. FDD software not only helps energy managers identify energy conservation measures (ECMs), but it can also automatically notify facility operations and maintenance (O&M) teams when energy waste occurs. And it can do that long before the next utility bill comes in the mail.
Newfound awareness of the power of FDD is great, but let’s be honest: There’s still one huge part of the traditional energy management process that hasn’t been taken out of the spreadsheet world and into the modern software world — Measurement and Verification (M&V).
M&V is a specific and standardized process for quantifying the difference between the actual energy the building used and what it would have used without any intervention. And as we’ll see, besides Clockworks, the software marketplace hasn’t provided the tooling necessary to integrate M&V into FDD or make the M&V process itself more efficient.
We know this is true because we see the symptoms all the time (and you likely have seen them too):
-
- There’s the facility management (FM) decision-maker that doesn’t pursue FDD because they don’t think their team has enough time
- There’s the FM team that has 4,873 active faults in the last week and can’t figure out which wrench to go turn
- There’s the executive that wants to know whether that FDD program is really paying off, but can’t find the numbers
All of these are symptoms of not having accurate, automated M&V baked into the FDD software. As we’ve been building up the M&V capabilities of Clockworks, we’ve realized there are actually two types of M&V that FDD software needs to provide:
Top Down M&V
This measures the savings that hit the utility meter. These calculations are often retrospective and are used for reporting to validate the investment in the program and to earn utility incentives.

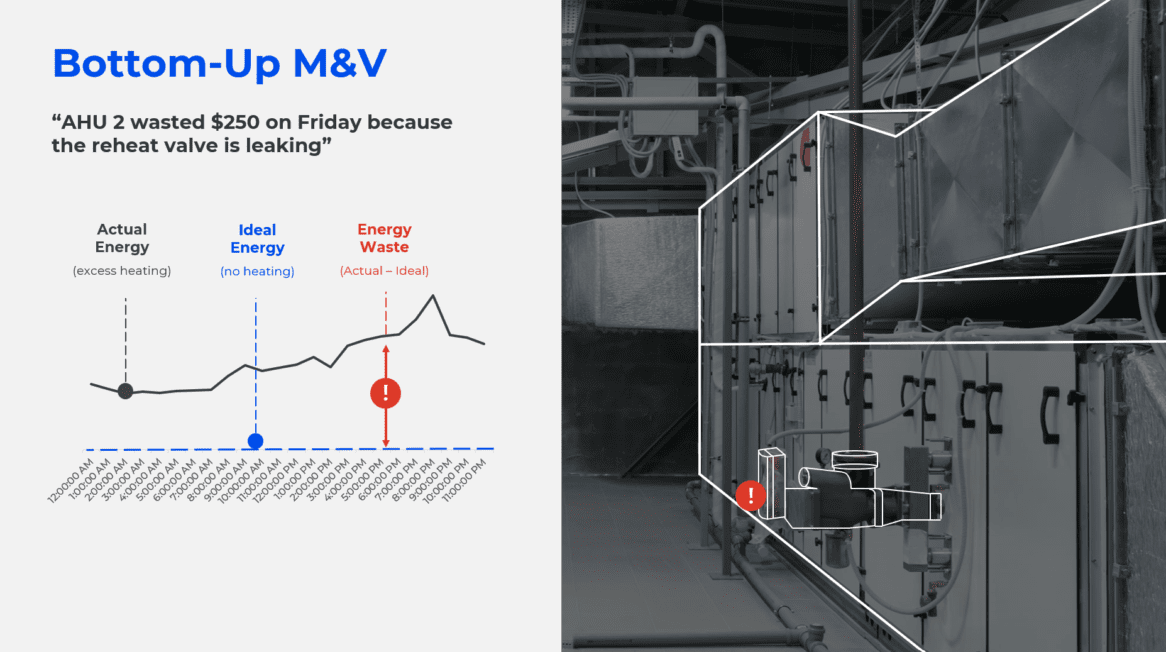
Bottom-Up M&V
This calculates the potential savings of individual FDD opportunities. It’s vital in the prioritization of faults to find the signal in the noise.

In energy management it is essential to know when meters are indicating that something is wrong—that energy consumption has increased against weather normalized historical performance. For portfolios, it is valuable to see energy use intensity by utility type across all buildings at once. Do we have similar facilities with very different energy consumption profiles? Comparing buildings against their past performance and against each other are critical table-stakes views for energy managers. Yet, the big challenge becomes…now what?
So, a building is using more energy than it should be. What do I do with that information? What action should I take? Do we manually investigate performance issues in the BAS? Do we pay an engineering firm to do an energy audit? Do we procure budget for manual retro-commissioning?
This is where “bottom-up” becomes critical, as FDD can pinpoint EXACTLY where the issues are occurring within your mechanical systems that are impacting performance.
Having these two capabilities integrated into one tool is crucial. And if you look at the software marketplace, there are very few options available for FM teams that recognize the value of having both top down and bottom up. It’s either one or the other.
Comparing Software Tools for M&V
Top-down-only options are typically referred to as Energy Information Systems (EIS) and there are a plethora of options. Sometimes, energy engineers use custom spreadsheets to do these calculations and reporting without software. The problem with this option is that it’s labor intensive and doesn’t accurately calculate the impact of FDD. It only compares usage against the baseline period—not what would have happened if the faults were not found. Of course, there are a lot of things that could have happened behind the meter, and it can be a challenge to isolate individual ECM’s (energy conservation measures).
The options for bottom-up-only are much more sparse. Most FDD platforms view built in energy savings calculations as optional—and therefore, their software doesn’t have automated savings built in. For those that do, it’s either an over-simplified rule-of-thumb method (e.g. dollars/per hour the fault is active) or it’s a black-box formula that can’t be verified for accuracy.
As a result of the lack of bottom-up capabilities, FM teams are forced to make up for the tool with a super-user. Usually, the super-user will create a crude savings estimate, use a spreadsheet-based calculator, or even build an energy model.
When we’re talking about a portfolio with thousands of pieces of equipment, the problems with this scenario are obvious:
-
- It’s extremely time-consuming
- It’s often inaccurate
- It’s difficult to maintain and keep updated
- The savings are not integrated with the top-down reporting methods
We at Clockworks believe the holy grail is to avoid doing any M&V calculations external to the FDD software. Clockworks is the industry’s only top-down and bottom-up FDD tool.
 Bottom-Up M&V: High-Priority Energy Issue with Root-Cause Diagnostic from Clockworks Analytics
 Top-Down M&V: Energy Insights Dashboard from Clockworks Analytics
Using FDD for Measurement and Verification (M&V)
This holistic approach to M&V allows FM teams to demonstrate to financial stakeholders the value of their work. And as facility teams continue to deal with skilled labor shortages and lack of resources, it has become more important than ever to accurately calculate both energy savings and the cost of inaction.
For operations and maintenance leaders, imagine the impact when you can accurately put a dollar value to that inaction and bring it to next year’s budget meeting. For energy managers, imagine being able to not only see which buildings are performing better than others and which ones have drifted from their baseline utility consumption, but ALSO be able to quickly identify the specific issues affecting that performance at the equipment and systems level.
