This release enhances the go-live experience by bringing greater visibility to deployment progress and delivering actionable diagnostic insights from day one. With a redesigned Deployment workspace and Early Diagnostic Results available at Go-Live, customers can track onboarding more clearly and begin improving building performance immediately.
Deployment Details Redesign
The Deployment feature got a major redesign to introduce new tabs that organize information across:
Deployment Summary – details of the deployment along with new fields for “Deployment Team” and “Deployment Milestones”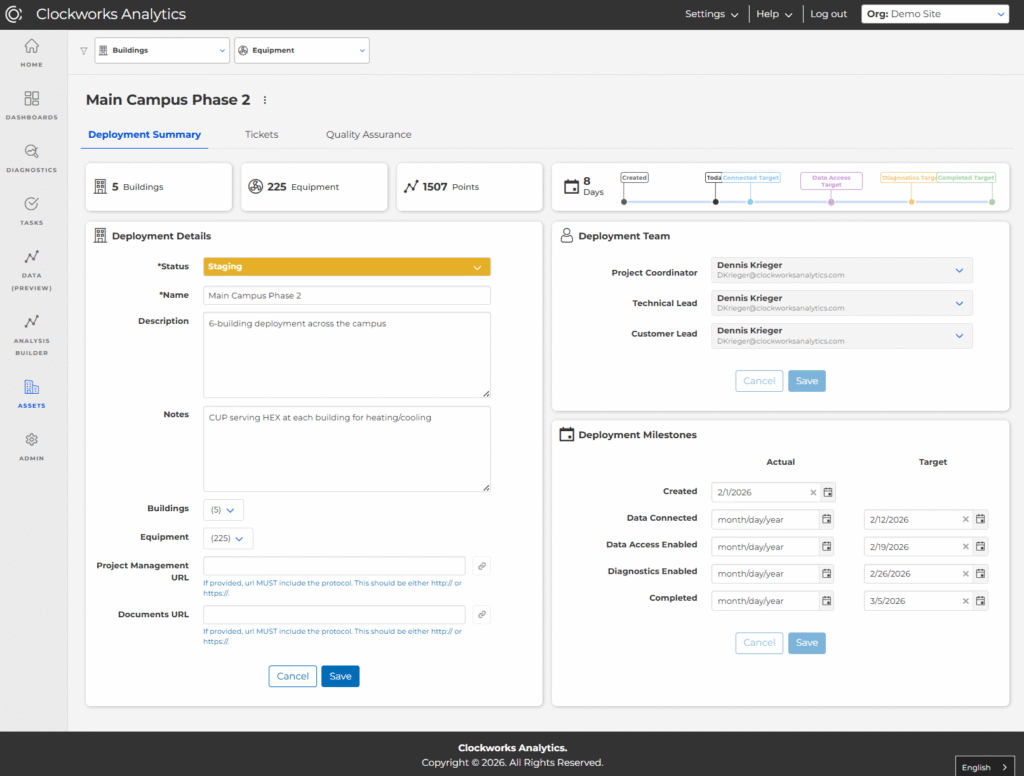
Tickets – customer-facing tickets for Building Setup, Data Connectivity, Information Requests, and Clarification Questions. Summary widgets above the table can be clicked to cross-filter the tickets table.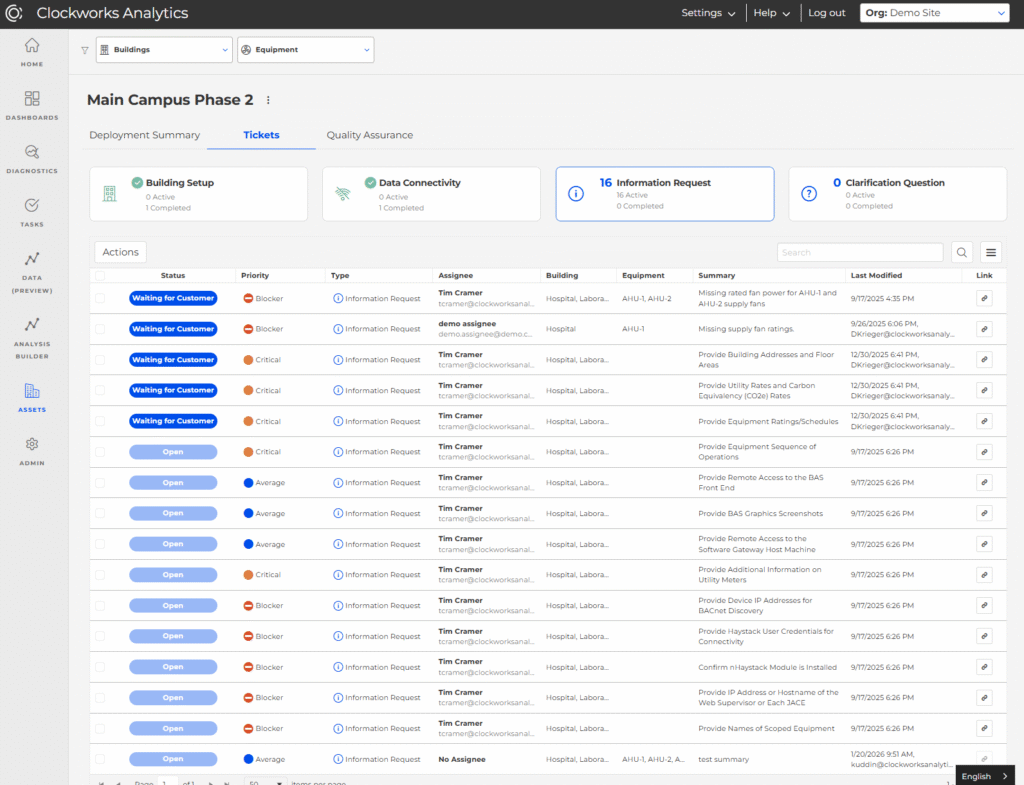
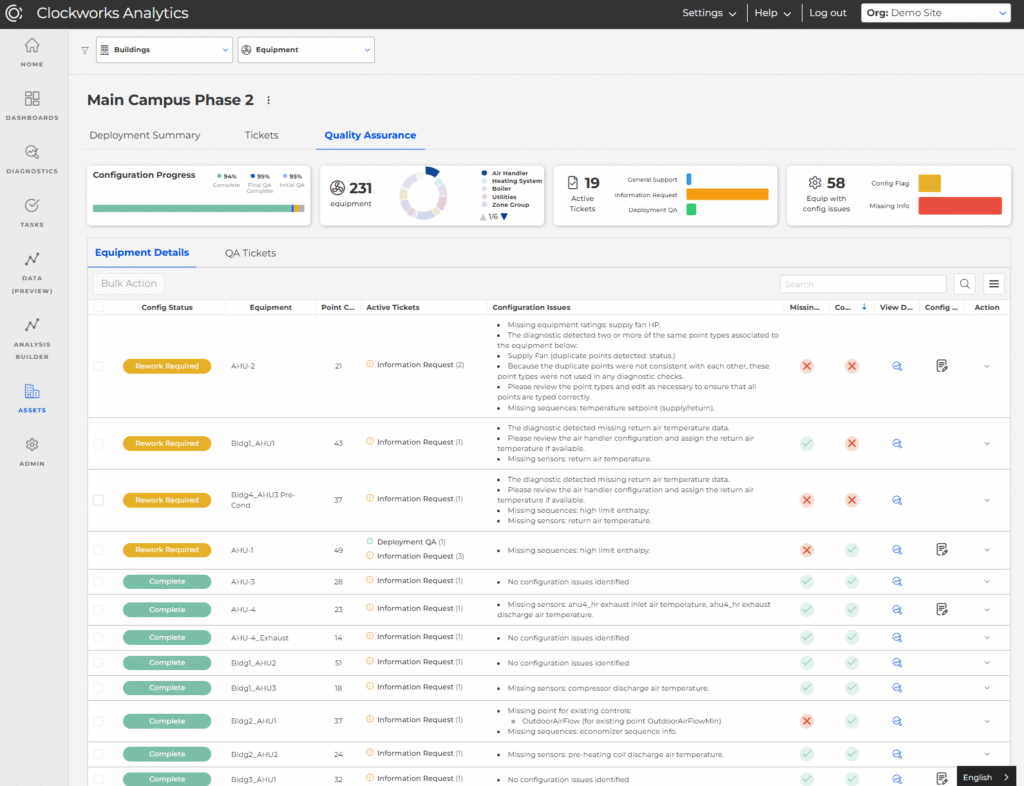
Quality Assurance – exposed to users with the Onboarding role only. This tab exposes configuration issues across all equipment, as well as a “QA Tickets” tab for organizing tickets created for correcting/improving the configuration of equipment.