


Product – Chart Templates and Related Equipment Faults
Diagnostics & Data Update
- By Dennis Krieger
Diagnostics, Data & Connections
This release connects the dots. Diagnostics now show you what else is going wrong on related equipment, the charts you build can be saved and shared as templates, and when a connection needs attention you can raise a ticket without leaving the page.
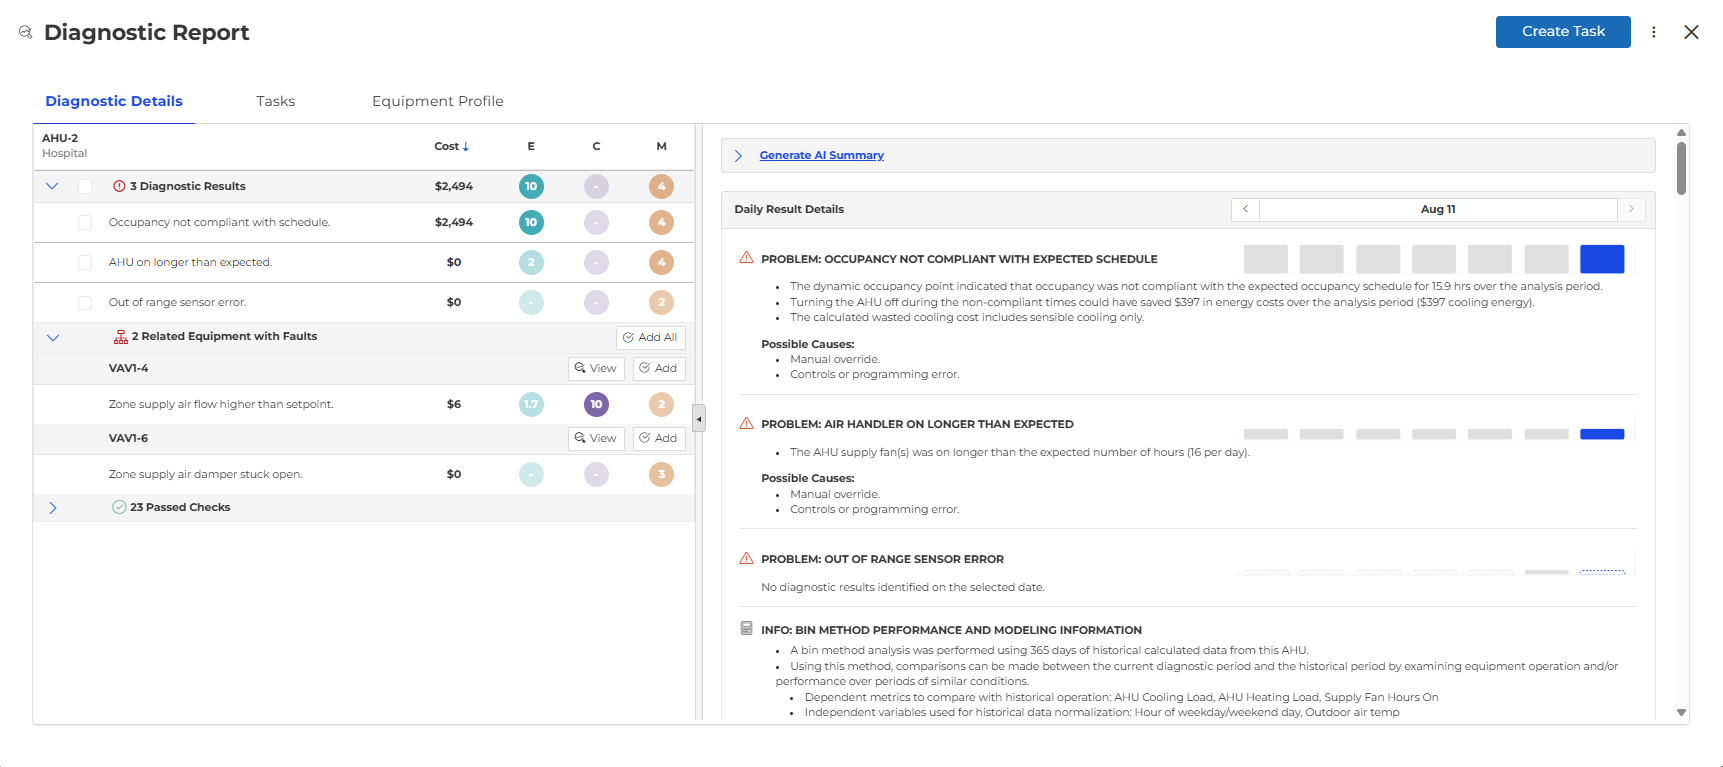
See related equipment faults:
When you open a diagnostic, you can now see faults found on connected equipment alongside it. A problem at the air handler and a problem at the zone it serves are rarely unrelated — surfacing them together means you diagnose the actual root cause instead of chasing each fault separately.
Save and share chart templates in Data:
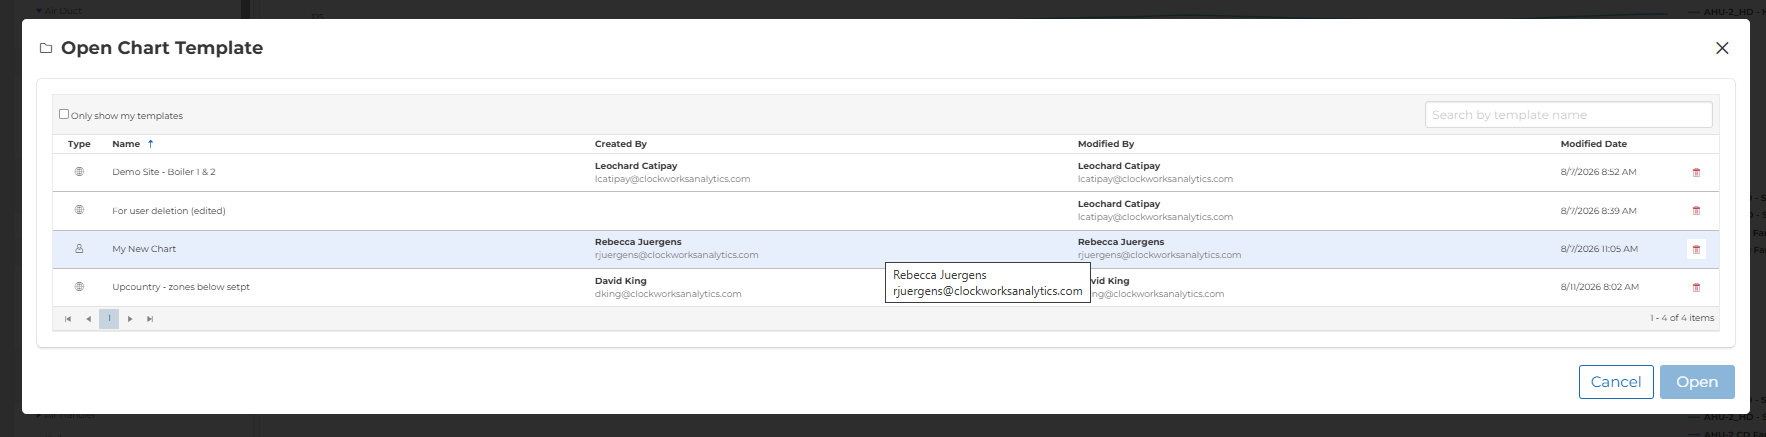
Charts you build in the Data module can now be saved as templates. Share a template across your organization so everyone works from the same view, or keep it private for your own routine checks. Open a saved template any time, update it with a new selection of points, or save it under a new name.
More data, grouped your way:
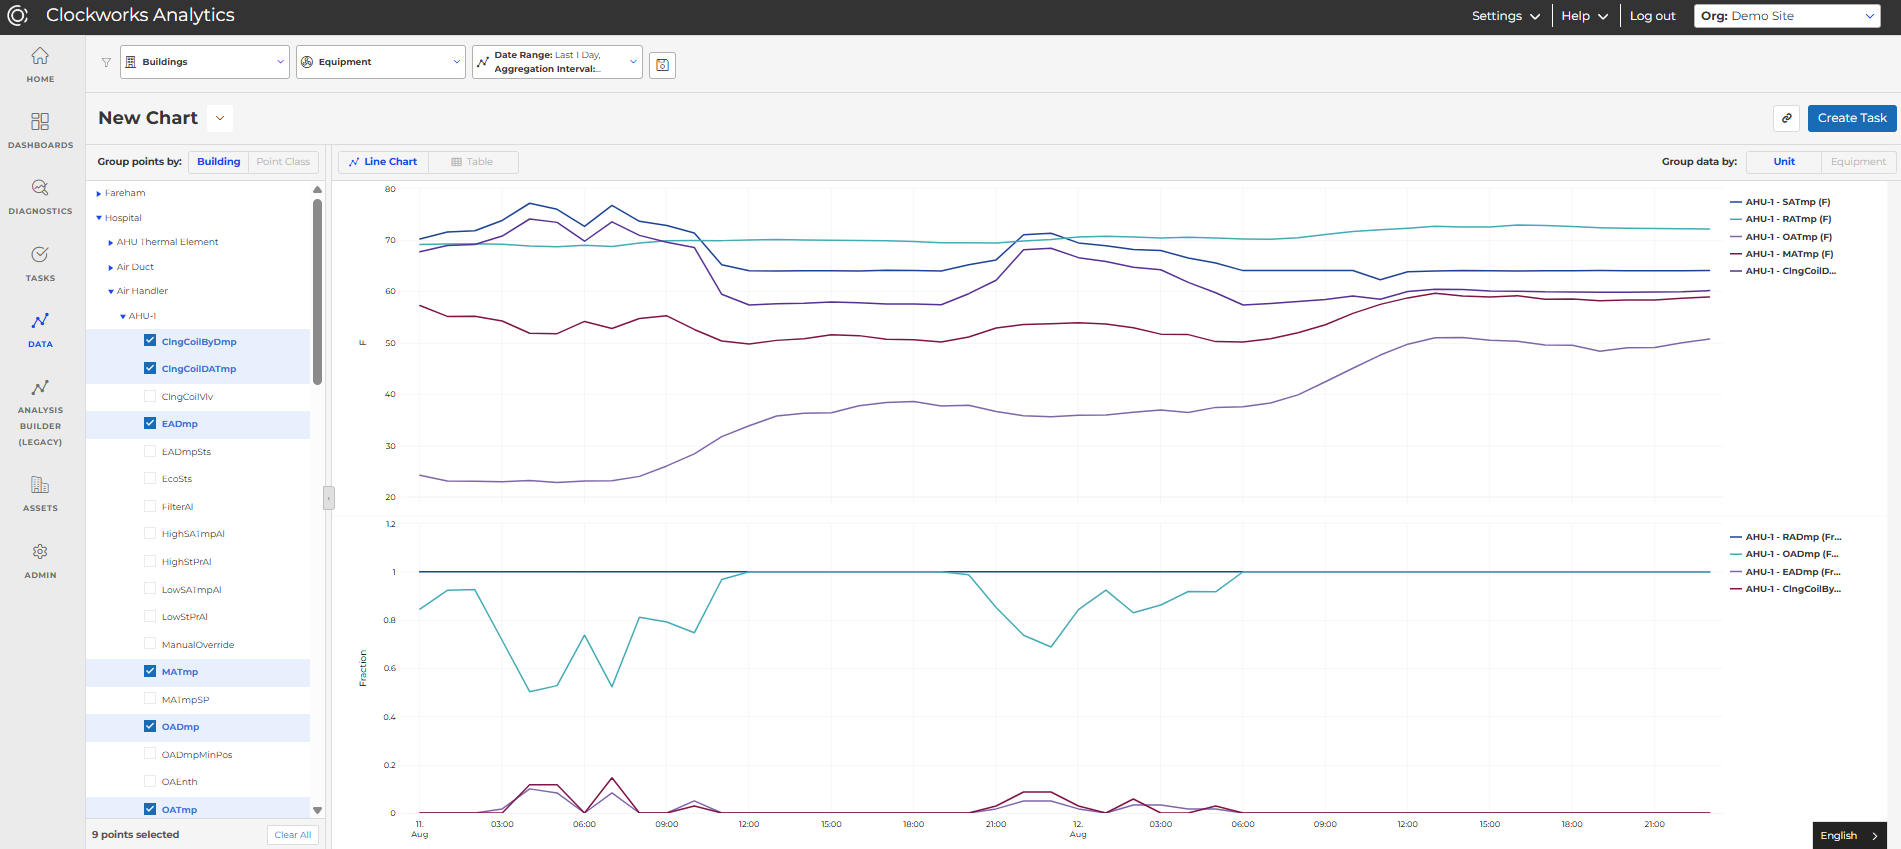
Date range filtering now extends past 30 days, so you can look at longer trends without exporting. New grouping options let you view data by unit or by equipment, and additional hyperlink parameters give you finer control over what a shared link opens to.
Raise connection support tickets in place:
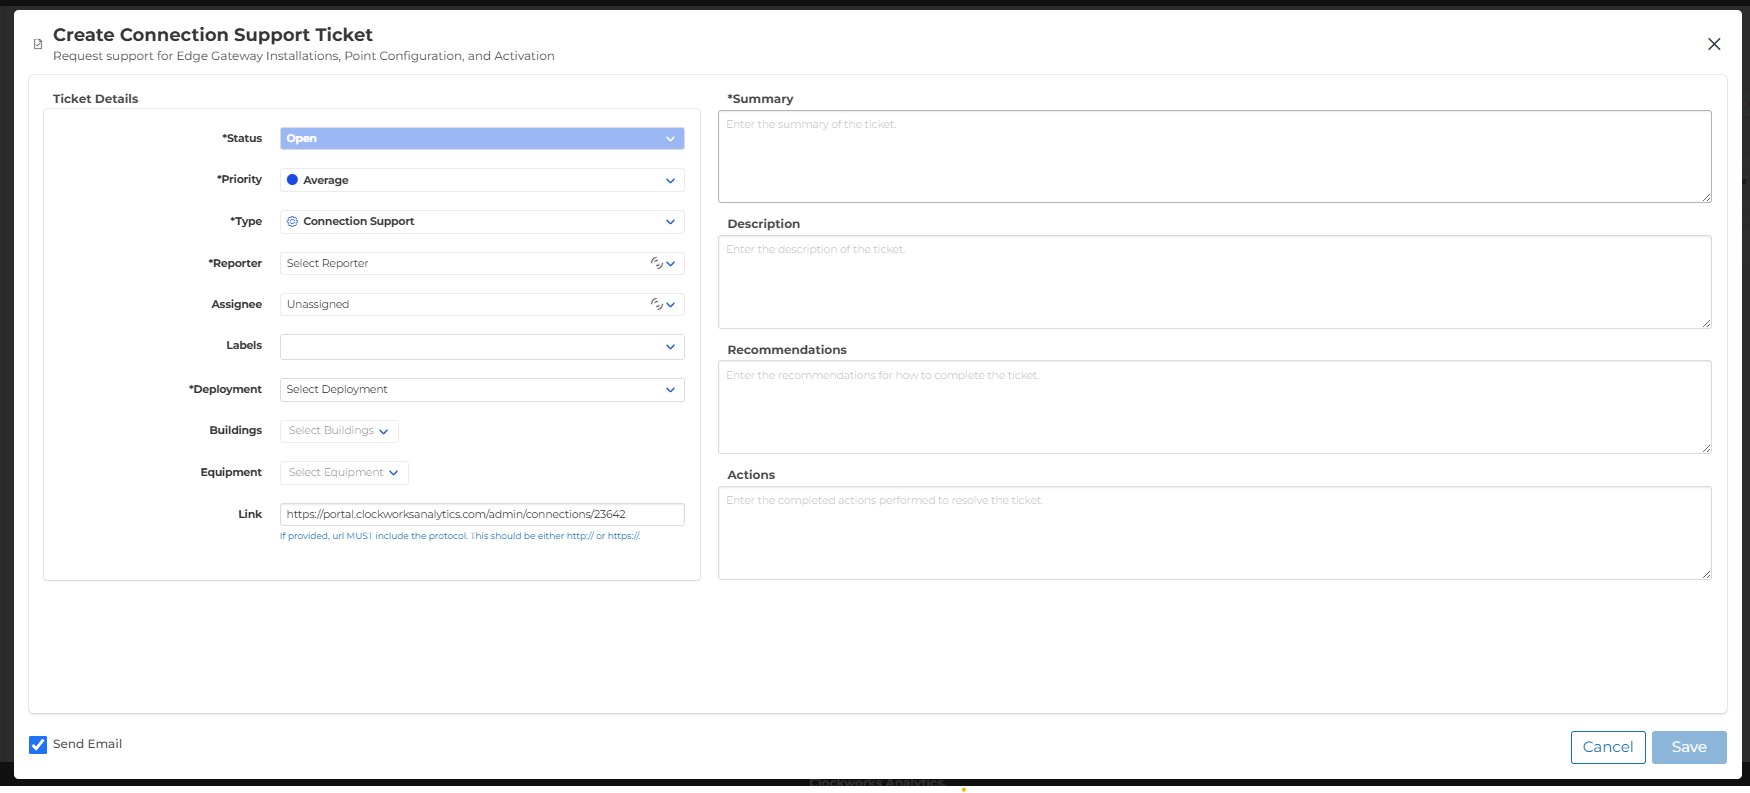
If a connection needs help, you can now generate an internal support ticket directly from Admin → Connections → Configure Points. The ticket populates on the Deployment page, so the request is visible to the team working that deployment without a separate handoff.
Share the Post:
Related Posts

Meet Sprocket AI Chat: Ask Your Buildings Anything
October 7, 2026