


Product Release – April 23, 2026
Data feature, filtering, and speed updates
In this release: A major speed boost for multi-organization users, click-to-cross-filter on Diagnostics and Tasks, and a big leap forward for the Data feature on its path to replacing Analysis Builder.
What’s New?
A noticeable speed boost when loading the application
This release delivers a substantial performance optimization for users who have access to many organizations. With a single organization selected, application load times have dropped from over twenty seconds to roughly five. The same speed-up applies when opening Diagnostics, Tasks, or any other page in a new tab.
You’ll feel this change every time you log in.
Click-to-cross-filter on summary widgets
Summary widgets above Diagnostics and Tasks tables are now interactive. Click any tile — count of equipment with a high comfort priority, critical equipment summary, priority trends, in-process or on-hold task counts — and the table below filters and sorts to match. Click again to clear and reset.
This works on both:
- Diagnostic Results summary widgets
- Tasks summary widgets
It’s the fastest way to go from “what stands out?” to “show me exactly those.”
Data feature: a major step toward replacing Analysis Builder
We’re continuing the push to make the Data feature the primary place you build, explore, and act on analyses, with the goal of retiring Analysis Builder in calendar year 2026. This release brings the Data feature meaningfully closer to that bar.
- Clearer point-tree navigation, with highlighting that makes it obvious which points you’ve selected.
- Updated chart legends so it’s easy to tell which points are plotted on each broken-out chart.
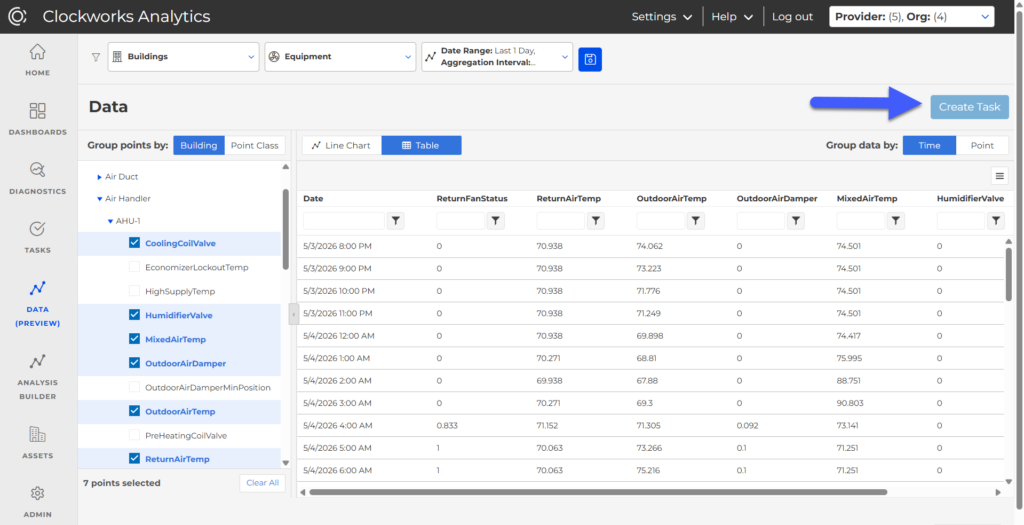
- Table view brought over from Analysis Builder — see timestamps and values directly alongside your charts.
- New aggregated-across-time view. In addition to grouping by time, you can now group your data by point with aggregated statistics (average, sum, max, and more) across your selected date range—the same approach used in our Performance Insights dashboards.
- Toggle between the time-based view and the aggregated view with a single selection. Useful for spotting things like set points that aren’t resetting, or unusually high CO₂ values across all of your zones.
- Create a task directly from the Data feature. When you spot something interesting while exploring the data or building a chart, turn it into a tracked task without leaving the page. This wasn’t possible before.
- Save a chart against any task. Every task now has a field for an attached chart. Come back to the task weeks later and jump straight back to the exact chart you built while troubleshooting—same equipment, same points, same context.
The Data feature remains a preview feature for now, but these changes move it close to production-ready.
Admin: self-service organization download
Download a complete organization configuration on demand — useful for backups, audits, and migrations.
Share the Post:
Related Posts

How to Build a Sustainable FDD Program: 5 Steps That Work
August 10, 2026